+44 (0)7460 109038

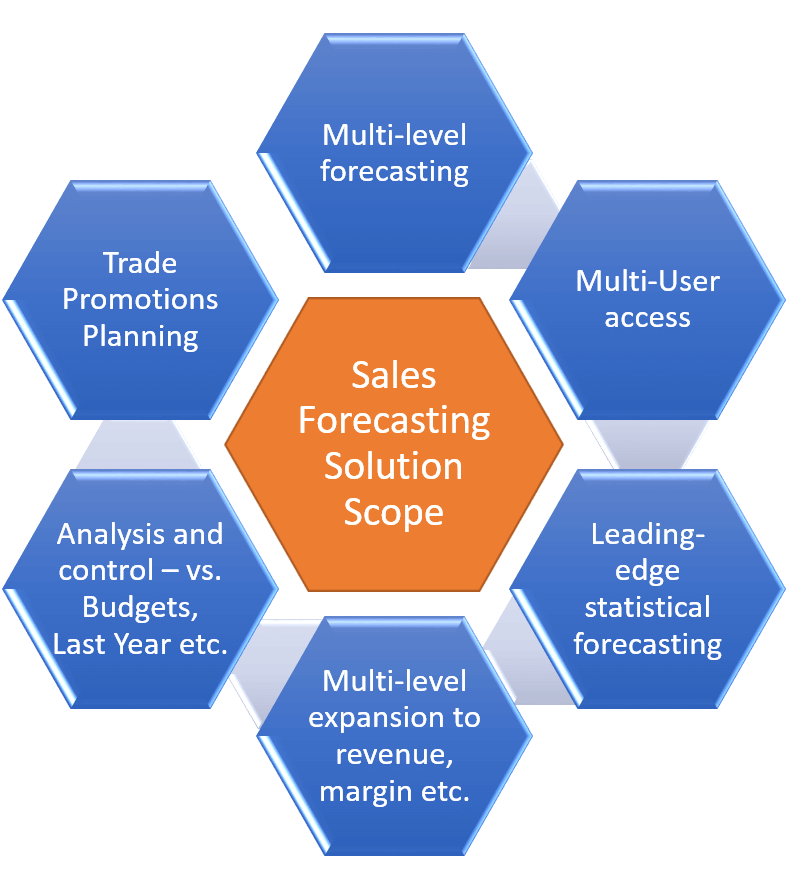
This page covers the 6 main pillars of any demand forecasting solution.
Here’s a graphical summary:

Multi-level demand forecasting means forecasting through time, over measures, across multi-level hierarchies of customers and products.
In other words, it lets you forecast at the level of hierarchical detail that exactly meets your need at the time. Bottom-up, top-down or middle and both ways.
It’s true that there is probably no substitute for forecasting at the sku level for the best accuracy. However, a top-down view and forecast override can help correct generally over-optimistic or over-pessimistic forecasts at the sku level.
And top-down saves potentially many hours of manual work when flexing Budget.
Prophecy supports bottom-up, top-down and middle and both ways multi-level forecasting, subject to each user’s security setting.
Forecasting is seldom a single-user activity. Frequently it is the major account sales people who are the active forecasters – after all, they know most about what is going on in their customers.
Concurrent multi-user access to a forecasting solution is a technical challenge. Spreadsheet based solutions face this major hurdle.
Without a single-source, shared forecasting solution you get:
Prophecy has supported multiple user, concurrent read-write access to a single, shared database from day 1.
Business forecasting in the real world doesn’t always lend itself to statistical forecasting. Peaks and troughs caused by promotions, competitor activity, distribution and listing changes and other non-recurrent factors don’t reliably happen at the same time each year. Statistical algorithms don’t ‘know’ about them.
However, with effect from February 2019, Prophecy statistical forecasting received a major ‘power-up’. It now enables Prophecy users to run of all the forecasting algorithms in the open source R framework for statistical computing, either in ‘Automatic’ mode (forecaster requires minimal statistical / zero R knowledge) or ‘R-Expert’ mode (which provides ‘to the metal’ access to all elements of the full R framework).
As a result, Prophecy enables the generation of statistical forecasts on a par with the very best statistical forecasting systems.
If your forecasting solution cannot integrate volume forecasting for production and inventory control with financial forecasting, how do you know whether what’s planned to sell will deliver the financial forecast?
At a minimum, the volume plan must feed through selling prices and standard costs into revenue and margin forecasts. Ideally, volume, revenue and margin forecasting will be handled in the same solution, removing latency and giving an instant financial forward view.
It probably won’t be relevant (or practical) to analyse revenues and margins at sku and customer level – way too much detail. So using a multi-level view of the financial measures through time is the way to go. Start, for example, at a product group and customer sector level. Then drill through the hierarchies to identify issues or opportunities.
In Prophecy, depending on the measures you configure in your database, you can view revenue, margin or any other measure at any combination of product and customer level through time. For every volume forecast there is a revenue and margin forecast. Prices can be imported or manually forecasted and standard costs are imported automatically. Prophecy handles the hierarchical solves, in real time, providing an always-on view of the financial data broken down over the full hierarchies.
Demand forecasting generates A LOT of numbers! Especially when you’re extending to revenues and margins over large hierarchies of products and customers. You need a solution which lets you tame this data overload and helps you compare the evolving forecasts with previous years, Budgets and Plans.
Prophecy uses a multi-dimensional reporting and graphical environment which lets you flexibly create your own reports and forecast update screens. These screens support drilling though the hierarchies as well as ‘data-driven’ product and customer selections. (An example of a ‘data-driven’ selection is “retrieve the data for products which are currently forecasted at 10% or more below Budget”.)
Prophecy supports a ‘rolling’ forecast for the standard forecasting cycle – i.e. a new forecast version is published each month, with a backward view of (say) the previous 11 versions. In addition, any number of ‘ad-hoc’ versions can be created – for Budgets, Targets or What-If explorations.
Prophecy’s powerful analysis and reporting environment supports full comparatives between all these versions, such as current forecast version versus a Budget.
Prophecy also provides an optional forecaster / reviewer management work-flow cycle.
Itemised Trade Promotions are very important to many businesses. For these businesses, it’s important to be able to handle the forecasting of these promotions from within their overall forecasting solution.
Prophecy has an optional Trade Promotions Planning module that lets your forecasters plan and manage trade promotions, and to analyse each promotion’s planned and actual incrementality within Prophecy. It aims to provide an appropriate level of business benefit from Trade Promotions Planning, without the very considerable implementation and maintenance complexities and expenses associated with the more full-blown Trade Promotions systems available.
There are at least 6 major elements of a viable demand forecasting software solution. One that services all the business processes and helps everyone plan and control the future from within a single, consistent, robust solution. If you’re looking to cover these bases in your new demand forecasting software solution, Prophecy is a great place to start your search!