
+44 (0)7460 109038


Every forecaster knows that there is no single, ‘best practice’ way to forecast sales of an item. But if different items possess different ‘forecastability’ characteristics, surely one can infer different best methods for forecasting them, and hence improve productivity and forecast accuracy.
By ‘forecastability’, we mean identifying how capable of being forecasted an item actually is. Are some items totally unforecastable, for example?
Consider an item that is ordered very intermittently and irregularly through time. Assume also that each order is totally different in quantity to the preceding and following order. Demand like this is called ‘lumpy’ in the forecasting literature. Arguably, items like this are actually impossible to forecast accurately:
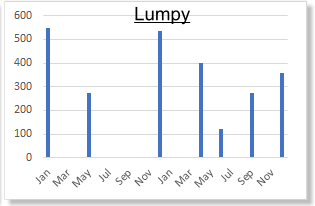
Options for addressing ‘Lumpy’ demand are:
If none of these options are possible then a question has to be answered over whether it is economic to sell this item due to the high cost of meeting demand.
The other end of the ‘forecastability’ spectrum is items which are ordered regularly and where the demand level is similar each period. These items have ‘Smooth’ demand:
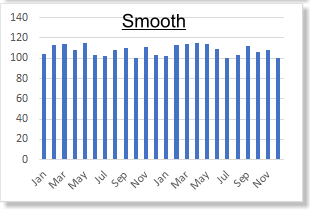
These items are relatively easy to forecast. They are very suited to automated statistical forecasting (e.g. using Prophecy’s R forecasting engine). Software, such as Prophecy, should have functionality that helps you quickly identify these items and push them into the statistical engine.
Located between the ‘Lumpy’ and ‘Smooth’ groups are the ‘in-between’ items.
An item with ‘Intermittent’ demand has irregular ordering time periods, but a similar quantity in each order:
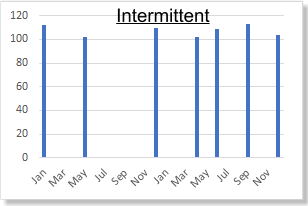
These items require a similar approach to the ‘Lumpy’ category. Forecasting at a higher level of product aggregation can even out the demand interval and make the item easier to forecast, if it’s not possible to work with the customer. For low volume items, the cost of safety stock may be a fallback where neither of these options works.
Finally, ‘Erratic’ items. These have orders every forecast period but at vastly different levels. They are likely to be highly seasonal or promotional.
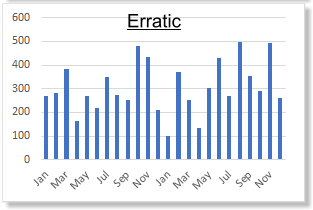
Seasonal items can still be forecasted using statistical methods. Many statistical forecasting models, including those in Prophecy™, employ ‘outlier detection’ to remove the peaks and troughs of promotions, allowing you to forecast the ‘standard sales’ statistically and overlay promotions afterwards (e.g. using Prophecy™’s Trade Promotions Planning module).
These items require the highest ‘judgemental’ element to the forecasting process. Particularly for items where the statistical forecasting MAPE (mean average percent deviation) proves high – i.e. erratic or no seasonality.
A forecaster can only “play the hand they’ve been dealt” and one has to be realistic about how easy or difficult the different items can be to forecast.
However, the strategies described here at least provide a starting point to making the best of the hand.
Pulling the four demand categories together into a single view we get:
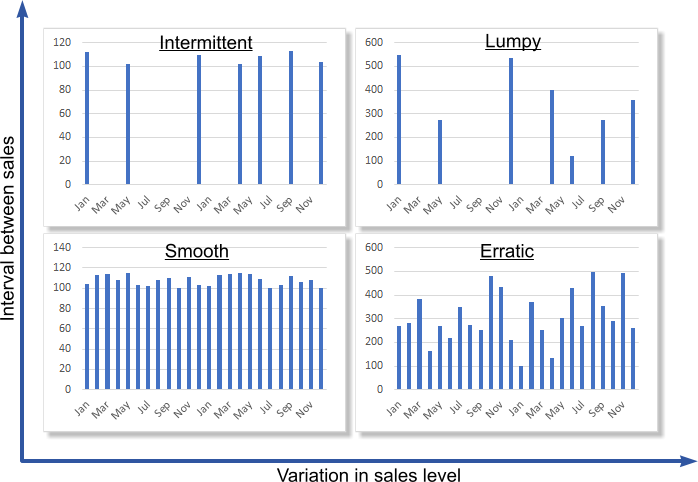
As illustrated above, forecastability is a function of demand level variability (the x-axis on the quadrant graphic) and demand interval variability (the y-axis on the quadrant graphic).
Demand level variability is measured by the Coefficient of Variation (CV) : the ratio of the standard deviation to the mean. A high variation from the mean indicates a high variability of demand.
Demand interval variability is measured using the Average Demand Interval (ADI). For example, say there are 36 time periods in the history but only 12 have a sale. The ADI would then be 36 / 12 = 3. In other words, on average, a sale occurs every three periods.
Plotting the CV and the ADI provides the quadrant analysis shown in the preceding graphic. In Prophecy™ you’ll see it rendered like this:
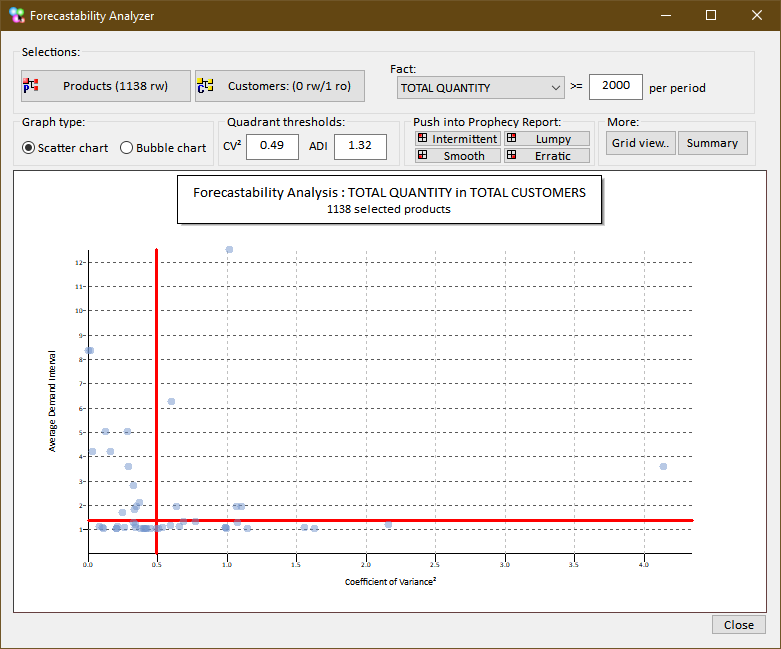
The red lines delineate the quadrants. Hover tooltips help identify the quadrants or the item at each plot point. The items from any quadrant can be instantly pushed into a Prophecy report and statistically / judgementally forecasted with a single click of one of the buttons in the panel labelled ‘Push into Prophecy Report..’. You can filter out low volume items, which can make it harder to see spot the key forecastability opportunities. Finally, the graph can also be rendered as a ‘bubble’ plot, where the size of each bubble corresponds to the average sale per period.
Being able to categorise items for their ‘forecastability’ characteristics has the potential to make forecasters more productive, by helping them to:
Some people, particularly those who are not directly responsible for forecasting, have unrealistic expectations about forecast accuracy. ‘Forecastability’ measurement can help them understand the issues in a more data-driven and objective way, particularly relating to the ‘lumpy’, or unforecastable items.