
+44 (0)7460 109038
Forecast bias measurement determines whether there is a general tendancy to over-forecast or under-forecast.
If the objective of demand forecasting is to forecast as accurately as possible then forecast bias is undesirable.
This article describes several methods for calculating or measuring forecast bias
It might be argued that a bias towards over-forecasting is a 'good' thing because it avoids lost sales and disappointing customers.
Or that under-forecasting is a 'good' thing because it reduces the risk of excess inventory and potential obsolescence, leading to better cash flow and cost savings
However, the argument for over-forecasting probably confuses safety stock planning with forecast bias. It is probably better business practice to develop a safety stock policy to offset the risks of lost sales and disappointed customers. And systematic under-forecasting, a persistent inability to supply customers, affects the longer term perception of the business to its customers, as well as negatively affecting sales and profit in the short term.
Therefore measuring and tracking forecast bias is an important element of your forecasting process.
The tracking signal helps monitor forecast bias over time by calculating the ratio of cumulative forecast errors to the mean absolute deviation. Here is a worked example:
The table shows six periods of forecasts and actuals, a variance for each period and a cumulative variance.
The Mean Absolute Deviation (MAD) is calculated as the average of the deviations, irrespective of their signs.
The Tracking Signal for each period is calculated by dividing the cumulative variance by the MAD.
A negative Tracking Signal means a tendancy to under-forecast. A positive Tracking signal means a tendancy to over-forecast.
However...As you can see, there was a single, large over-forecast in Period 3, which made the Tracking Signal switch from negative (under-forecasting bias) to positive (over-forecasting bias).
Although the Tracking Signal comes down over time, reflecting under-forecasts in the remaining periods, it remains positive.
This makes the Tracking Signal a potentially misleading indicator of bias. In the sample data, by period 6, there are five periods under-forecasted but only one period over-forecasted, yet the Tracking Signal implies a tendancy to over-forecast. If all the periods were forecasted contemporaneously then, perhaps, the Tracking Signal result is appropriate. On the other hand, if each period was forecasted in a different forecast cycle (i.e. non-contemporaneously) and five out of six forecasts were under-forecasted, then asserting a bias towards under-forecasting combined with a single, particularly inaccurate (but not biased) forecast is an equally plausible interpretation of the data.
This issue makes the Tracking Signal a 'use with care' measure. Without reviewing the actual detail, it may misdirect.
The Normalised Forecast Metric for a single forecast vs. actual observation ranges from -1.00 to +1.00, where a value of zero indicates the absence of bias. Because the range of NFM is always from -1.00 to +1.00 it provides a basis for comparing items with different sales levels.
The formula for each forecast vs. actual observation is:
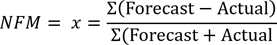
The following table illustrates the calculation method for 6 observations and the total NFM.
Note that the 'Total' NFM is calculated by summing the individual observation NFMs. So, to answer the question of whether there is overall bias in the example data, we know that the range for total NFM is -6.0 to +6.0 (because there are 6 data points). Therefore, we can conclude that the sample forecasts indicate a low bias (near to zero).
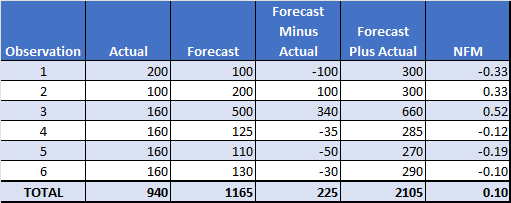
However, as with all of the previous methods for calculating forecast bias, the devil is in the detail. Two observations were over-forecasted and 4 were underforecasted yet the summary figure shows a small tendancy to over-forecasting because (particularly) the over-forecast for observation 3 was comparatively large. If you ignore observation 3 and calculate the NFM, it goes from 0.1 (minor over-forecasting) to -0.41, clear under-forecasting:
A frequency distribution of over and under forecast percent errors highlights potential bias in the forecasts. No bias in the forecasts means that 50% of the forecasts were over-forecasted and 50% were under-forecasted.
The following is an extract from a Prophecy Accuracy Analysis report:
Accuracy Band |
Over Forecasted (i.e. Forecast > Actual) |
Under Forecasted (i.e. Forecast < Actual) |
Total |
|||||||||
|---|---|---|---|---|---|---|---|---|---|---|---|---|
Count |
Cum Count |
Percent |
Cum % |
Count |
Cum Count |
Percent |
Cum % |
Count |
Cum Count |
Percent |
Cum % |
|
| 0 - 5% | 85 | 85 | 3.3% |
3.3% |
1201 | 1201 | 46.5% |
46.5% |
1286 | 1286 | 49.7% |
49.7% |
| 5 - 10% | 163 | 248 | 6.3% |
9.6% |
235 | 1436 | 9.1% |
55.6% |
398 | 1684 | 15.4% |
65.1% |
| 10 - 15% | 156 | 404 | 6.0% |
15.6% |
136 | 1572 | 5.3% |
60.8% |
292 | 1976 | 11.3% |
76.4% |
| 15 - 20% | 104 | 508 | 4.0% |
19.7% |
49 | 1621 | 1.9% |
62.7% |
153 | 2129 | 5.9% |
82.4% |
| 20 - 25% | 90 | 598 | 3.5% |
23.1% |
18 | 1639 | 0.7% |
63.4% |
108 | 2237 | 4.2% |
86.5% |
| > 25% | 312 | 910 | 12.1% |
35.2% |
36 | 1675 | 1.4% |
64.8% |
348 | 2585 | 13.5% |
100.0% |
The 'Cum %' cells in the bottom row of the table show that 35.2% of the forecasts were over-forecasted and 64.8% were under-forecasted. So, a tendancy to under-forecast. More insight can be obtained by analysing the distribution over the pre-determined accuracy bands (which can be user-defined).
However, the issue with this measure is that it ignores the size of each observation. In other words, a unit variance of 10,000 and a unit variance of 10 each account for one observation in the frequency distribution. Again, use with care and examine the detail.
Our free online forecast bias calculator runs in your web browser, transmits no data over the internet and calculates forecast bias using methods 1 and 2 above. Method 3 is included in our free, online forecast accuracy calculator. You can copy/paste your data into either calculator, type it in or load it from an Excel spreadsheet file.
The format of your data is as simple as we can make it - each line must contain a description (e.g. product), a forecast and an actual and no data is transmitted over the internet.
This review of frequently used forecast bias measure shows that the devil is invariably in the detail, finding a single number for bias is problematic and that even the 'best-practice' methods can mislead.
More actionable information may come from examining the significant deviations in forecasts, focussing on those that have had substantial impacts on business operations. The objective is to discern whether these deviations are primarily a result of systemic, institutional or behavioural over-forecasting or under-forecasting. This method is likely to yield more practical and actionable outcomes compared to the indiscriminate application of 'best practice' summary statistics.