Demand Forecasting Software Tour:Stop no. 1...
You need more than a library of statistical forecasting models!

Prophecy has a full collection of statistical forecasting models, which are delivered either in an automatic, virtually no statistical knowledge required way, or via full, integrated interaction with R, the open source statistics and data science framework.
But when it comes to viewing and analysing your forecasts, entering forecasts manually, or reviewing forecasts with others, you need a sophisticated, robust and easy to use software environment.
This is an area where Prophecy really eXcels! A huge amount of thought, creativity, real-world business forecasting experience and customer feedback has gone into making the non-statistical elements of Prophecy as brilliant as possible. This page aims to give a flavour, but we recommend a demo to fully see all of Prophecy's benefits.
Making forecasting software easy...
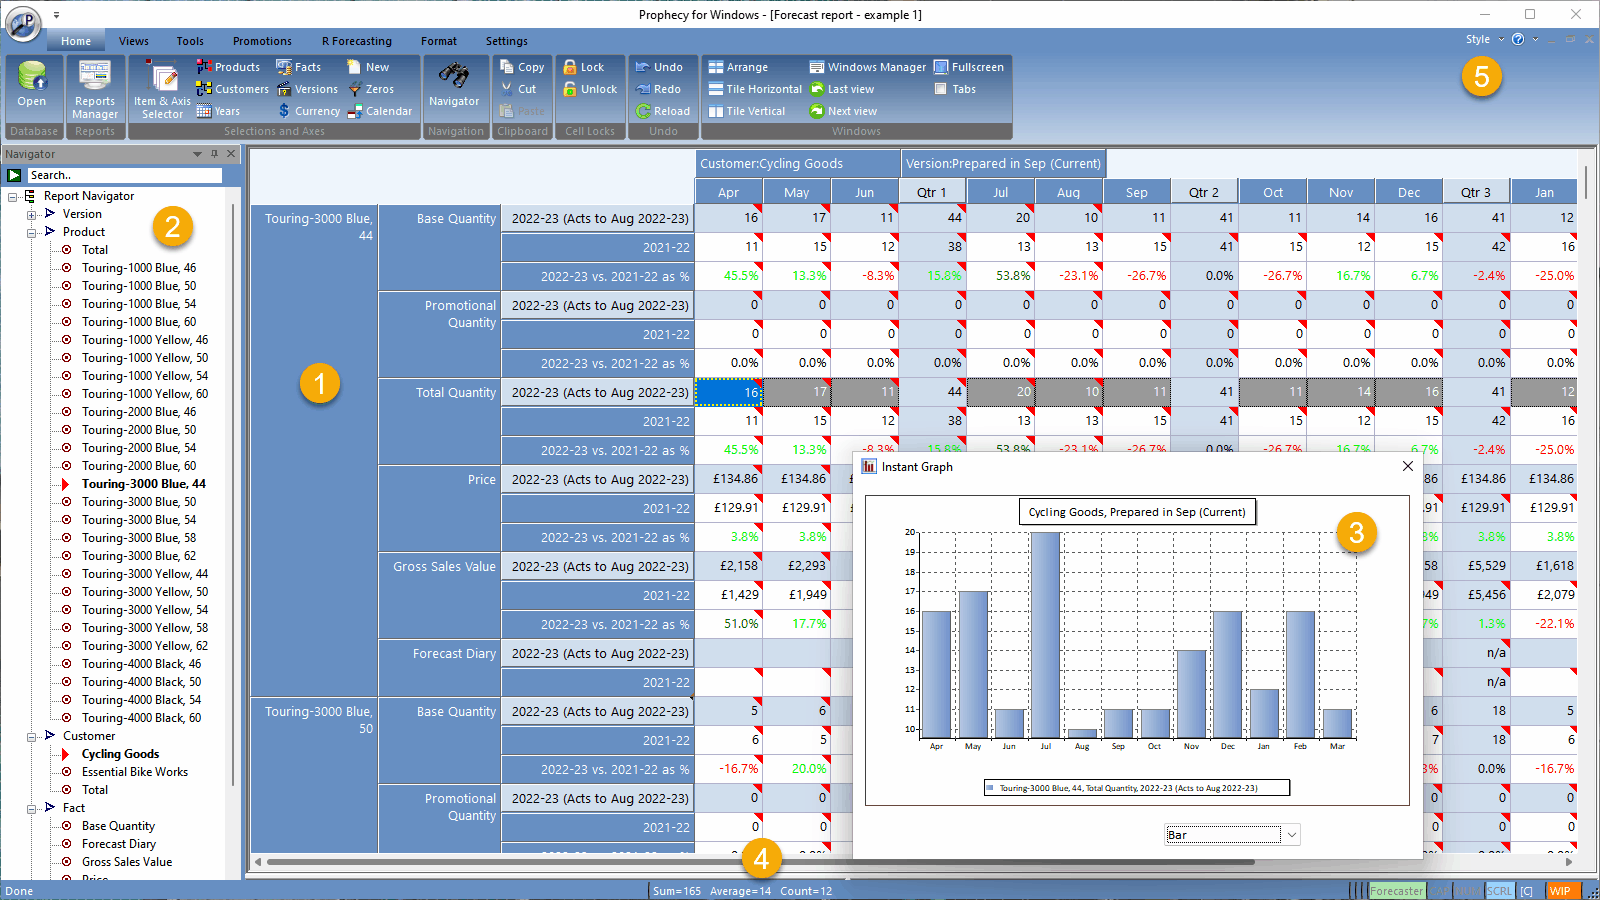
Here is an example from a Prophecy software session:

1
A Prophecy 'report' is also a forecast update screen. Therefore you can manually edit the forecasts in a near-identical way to editing cells in an Excel spreadsheet. However, unlike an Excel spreadsheet, you can:
- Freely nest and reorient the dimensions on any report axis (including pages). Unlike the cells of an Excel pivot table, Prophecy cells stay editable as you reorient and nest the dimensions;
- Navigate the product or customer hierarchies by double-clicking on an item whose children or parent you wish to see.
- Intelligently select cells to copy or graph based on their cell type. For example, smart-select time periods but ignore time subtotals using Ctrl + Right Cursor from the start cell in the required range.
- Enter the same number into a selected cell range by just selecting the range and typing. Or use the same approach to adjust (factor) the total of the range to a new total. Or use the same approach to add a fixed amount or percent to each cell in the range. Small features, but saving a lot of time!
- Change any total cell and all the dependent cells automatically adjust to deliver that total. (Obviously, read-only cells like year to date do not change!)
- Instantly generate a graph from any cell selection. One graph option is shown in item 3 . Prophecy graphs also support 'visual forecasting' via drag and drop of observations.
- ... and much more!
Notice also that the screenshot report shows both volume and financial measures. Your Prophecy database can be configured with any measures you require. Subject to a user's security settings, it is possible to change any measure and Prophecy will automatically recalculate ('backsolve') the dependent measures. Change quantity and, of course, Gross Sales Value recalculates (as well as NSV and Margin which are not shown in the current report). Just as simply, change the Gross Sales Value cell and Prophecy will backsolve to the Quantity required to deliver the target Gross Sales Value, at the current Price.
2
This is the 'Navigator', an optional window that displays the current report content in a logical view. Use it to quickly locate any item in a big report. When you click an item on the tree, the report cursor instantly jumps to the corresponding cell in the report, automatically scrolling it into view if it is currently off-screen. Note the quick search field at the top. No more scrolling of large Excel spreadsheets to find the item you want!
3
This is an 'instant' graph. Just select the required cells and press Ctrl + Spacebar . It 'floats' anywhere over your screen and you can create any number to display concurrently. They redraw, of course, as forecasts are changed in the report. Prophecy has more comprehensive graph options too, which are not covered on this page.
4
The application status bar shows the sum, average and count of the selected cells, just like Excel!
Of course, Prophecy is built-from-the-ground-up specifically for business sales and demand forecasting. It has a huge number of features that make it far superior to Excel for multi-user demand and sales forecasting.
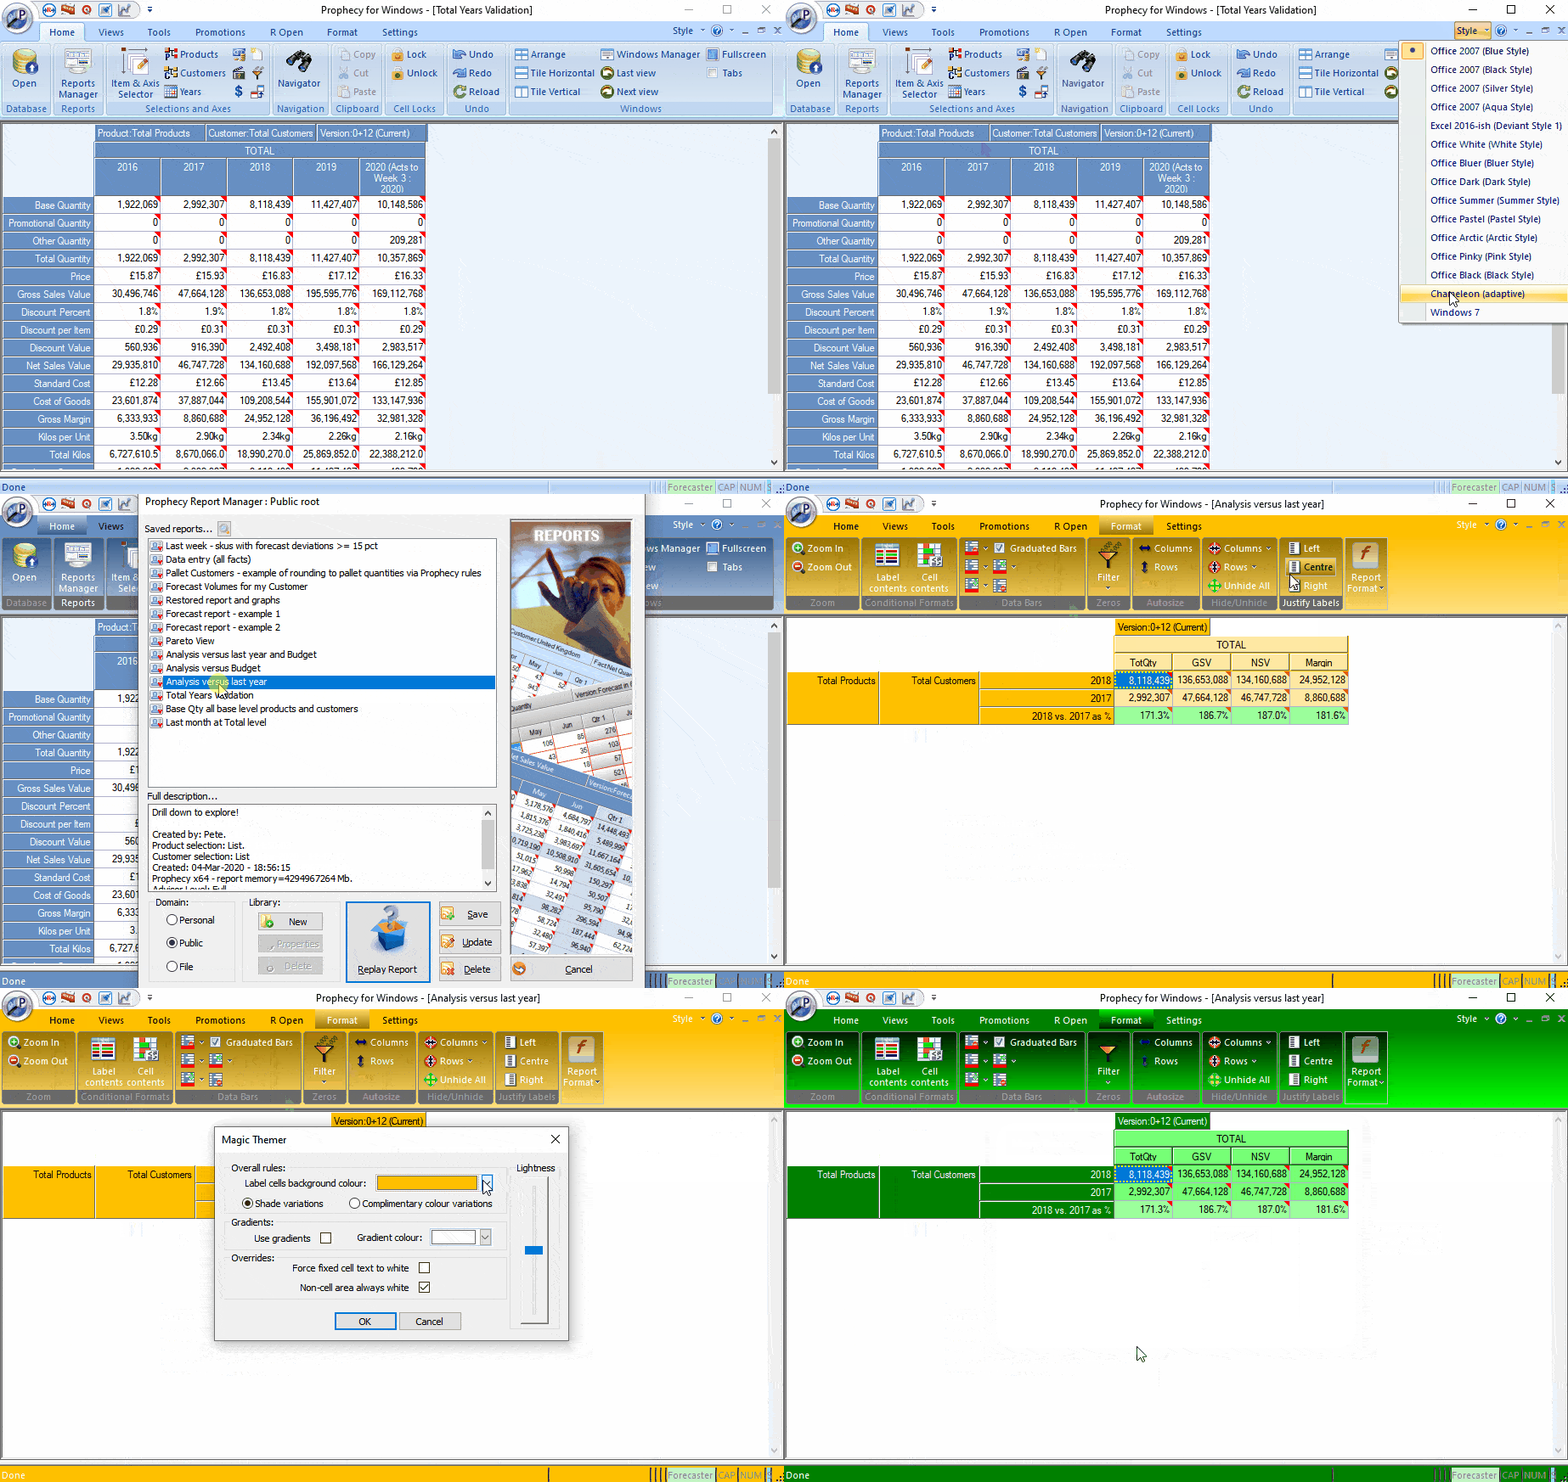
5
The Prophecy user interface works the same way as Microsoft Office products. Most users are already familiar with using Microsoft Office and therefore have no difficulty navigating Prophecy.
There are a number of colour themes to choose from - added by the Prophecy developer as a nerdy, 'fun' programming challenge! Here is a short, self-running demo:

